Material Escalation: How Price Cycles Work, and How to Tell When One Has Turned
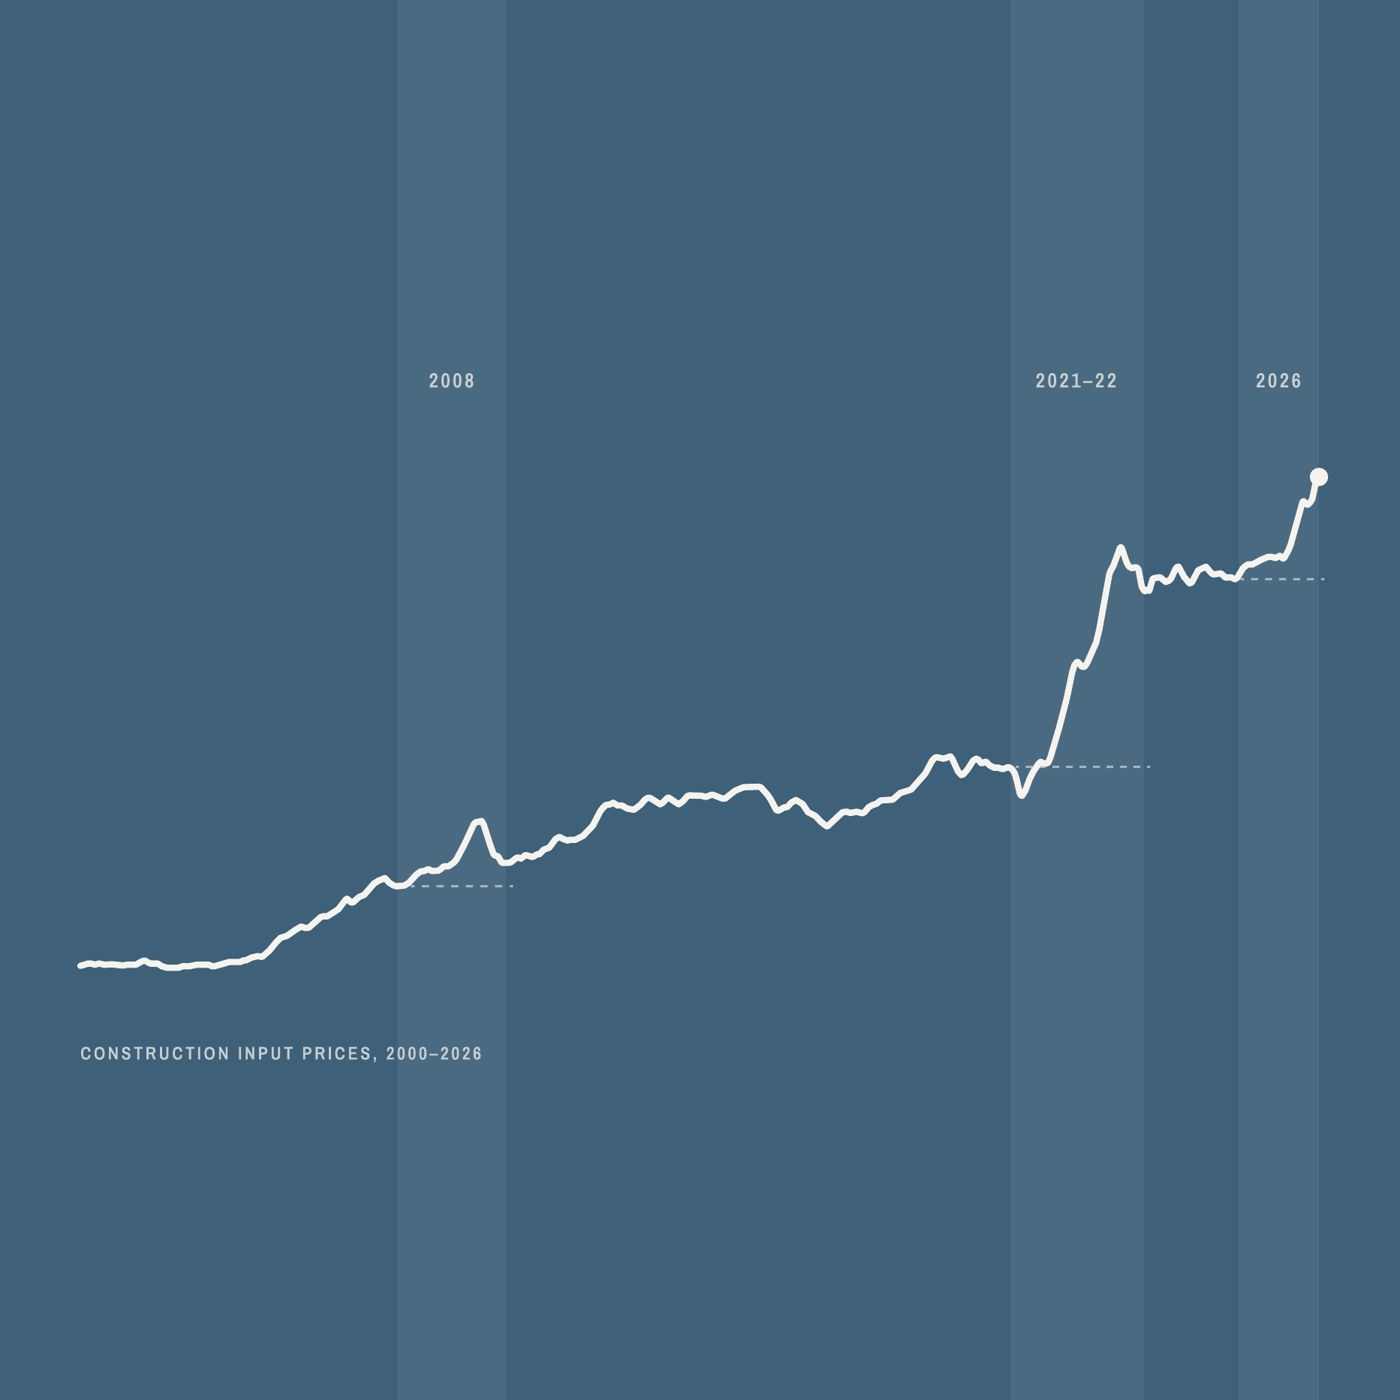
Construction input prices rose 11.5% from October 2025 to October 2026 (BLS, via ABC), about seven times the 2011–2020 average. Since 2000, prices have risen that fast only twice before, in 2008 and 2021–22. While both run-ups ended, each left overall prices higher than where they started. This briefing puts all three side by side: what started each one, what came back down and what didn't, and the signs that showed a price had turned.
Thanks, your download is starting.
If the download doesn't start, get the PDF here.Part 1What Causes a Cycle
Each run-up started with a price shock. How it ended depended on demand.
2008: a commodity spike, then a collapse
In 2008, the shock was a global commodity spike. Chinese demand drove up oil and metals, and with them steel and fuel. Oil topped $145 a barrel in July 2008 (EIA). Then the financial crisis brought it all down. Within six months, construction input prices gave back about two-thirds of their rise, and steel and diesel fell below where they started.
2021–22: shortages that lasted
The price shock of 2021–22 came from three things at once: pandemic shutdowns that cut mill and sawmill output, a building and remodeling boom fueled by near-zero interest rates, and Russia's invasion of Ukraine, which sent fuel prices soaring. Steel sheet more than tripled and lumber nearly tripled (BLS), and steel mill lead times went from about four weeks to more than ten (SMU). Electrical components were among the worst shortages, and equipment lead times kept stretching long after the shutdowns ended. Diesel peaked at $5.81 a gallon in June 2022 (EIA). Supply caught up and interest rates rose, but demand held up, and prices came down slowly.
2026: war and tariffs
This run-up is a price shock with no building boom behind it. Tariffs and the war are pushing costs up even as most construction slows. Since late 2024, construction input prices are up 15% in under two years.
The costs: tariffs and war. Tariffs and the war raised the cost of what nearly every job runs on: metal and fuel. Imported steel and aluminum have carried a 50% tariff since June 2025. Since April 2026, the tariff has also applied to the full value of many products made from them: 50% for products that are almost all metal, 25% for the rest. Some industrial and electrical grid equipment pays a lower 15% rate through 2027. The war with Iran has disrupted shipping through the Strait of Hormuz since late February 2026, and traffic is still well below normal. Diesel was $6.13 a gallon on Nov. 9, 2026 (EIA). Steel mill products and aluminum are each up more than 20% from a year ago (BLS, October 2026).
Demand outside data centers. Outside data centers, demand is weak. Private construction spending was down 3.8% in September 2026 from a year earlier, and factory construction was down 18% (Census Bureau). In AGC's summer 2026 survey, 55% of contractors had projects canceled, postponed or scaled back in the past six months.
Data center demand. Data centers are the exception. From September 2025 to September 2026, data centers and power projects accounted for nearly all of the gains in private nonresidential construction spending, while most other categories fell (Census Bureau data, via AGC). Data center buildings are only about 4% of all U.S. construction spending (September 2026), a share that sounds small because it counts the buildings, not the servers and equipment inside.
How data centers affect everyone else. Their demand is keeping metals tight. "Due primarily to the demand placed by data center and power projects, metals remain a dominant cost driver," Swinerton wrote in its fall 2026 market outlook.
On equipment, the squeeze shows up in lead times more than in prices. A technical sales consultant for a hydronic equipment supplier says data center demand hasn't moved prices much on his equipment for other projects. "I do think it does affect them in lead times," he said. A school might need three air separators; one data center he worked on needed 12 per suite, across 20 suites. Now, he said, a school can wait 18 weeks for an air separator that should take 10 to 12. He sees the squeeze upstream, too: with that much equipment going into data centers, carbon steel has become a choke point.
What it means. This time, lumber and other materials tied to general building could give back more of their increase than in 2022, because demand outside data centers and power projects is weaker. Metals and electrical gear, which data centers compete for, may not. In 2008, demand collapsed, and raw materials fell below where they started. In 2021–22, demand stayed strong, and most of the increase stuck. Finished-product prices are still unlikely to give much back. That's a reading of two past cycles, not a forecast.
Part 2Do Prices Come Back Down?
Some do. It depends on how close the product is to the raw material. Here's the 2021–22 cycle, product by product. Both numbers compare the price with where it was before the run-up began:
| Product (BLS index) | How far it rose | Where it ended up after falling |
|---|---|---|
| Lumber (softwood) | +174% | +13% |
| Steel sheet (cold-rolled) | +262% | +60% |
| Fabricated sheet-metal work (duct) | +38% | +36% |
Source: BLS producer price indexes. Both columns are measured from where each run-up started (the product's 2020 low, or January 2021 for duct). BLS doesn't track duct prices directly; the closest measure is what sheet-metal shops charge for their work, duct included.
Raw-material prices come down. Lumber gave back almost all of its rise. Steel sheet gave back three-quarters. Commodities trade every day, and their prices fall when supply catches up.
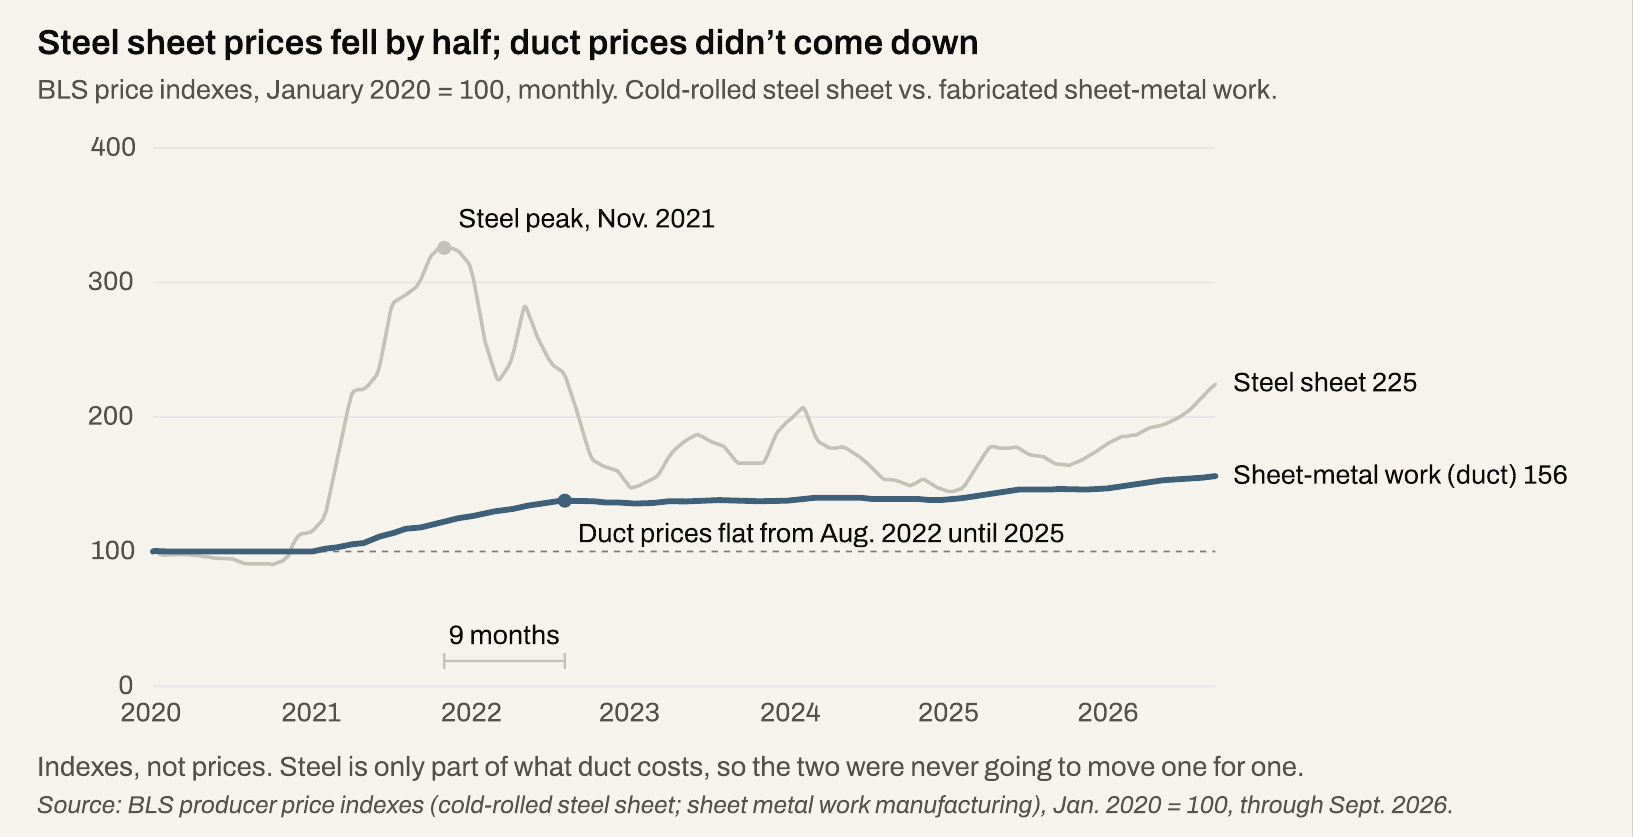
Finished-product prices barely come down. Duct prices kept rising for nine months after steel sheet peaked, then leveled off instead of falling, even as the steel it's made from dropped by half (chart below). A fabricator's price includes labor, overhead and margin, and those rarely go back down. The same thing happened in housing: in 2021, framing lumber prices fell about half while builders' lumber quotes stayed at record highs (NAHB).
The hydronic consultant sees the same thing from the supplier side. Asked whether prices came back down after past spikes, he said, "I don't think they necessarily come back down." Instead, he said, manufacturers skip their usual end-of-year price increase.
The overall index sets a new floor. Across all construction inputs, the annual average has fallen in only about one year in four since 2000, and never by more than about 4%. The chart below shows where prices landed after each cycle.
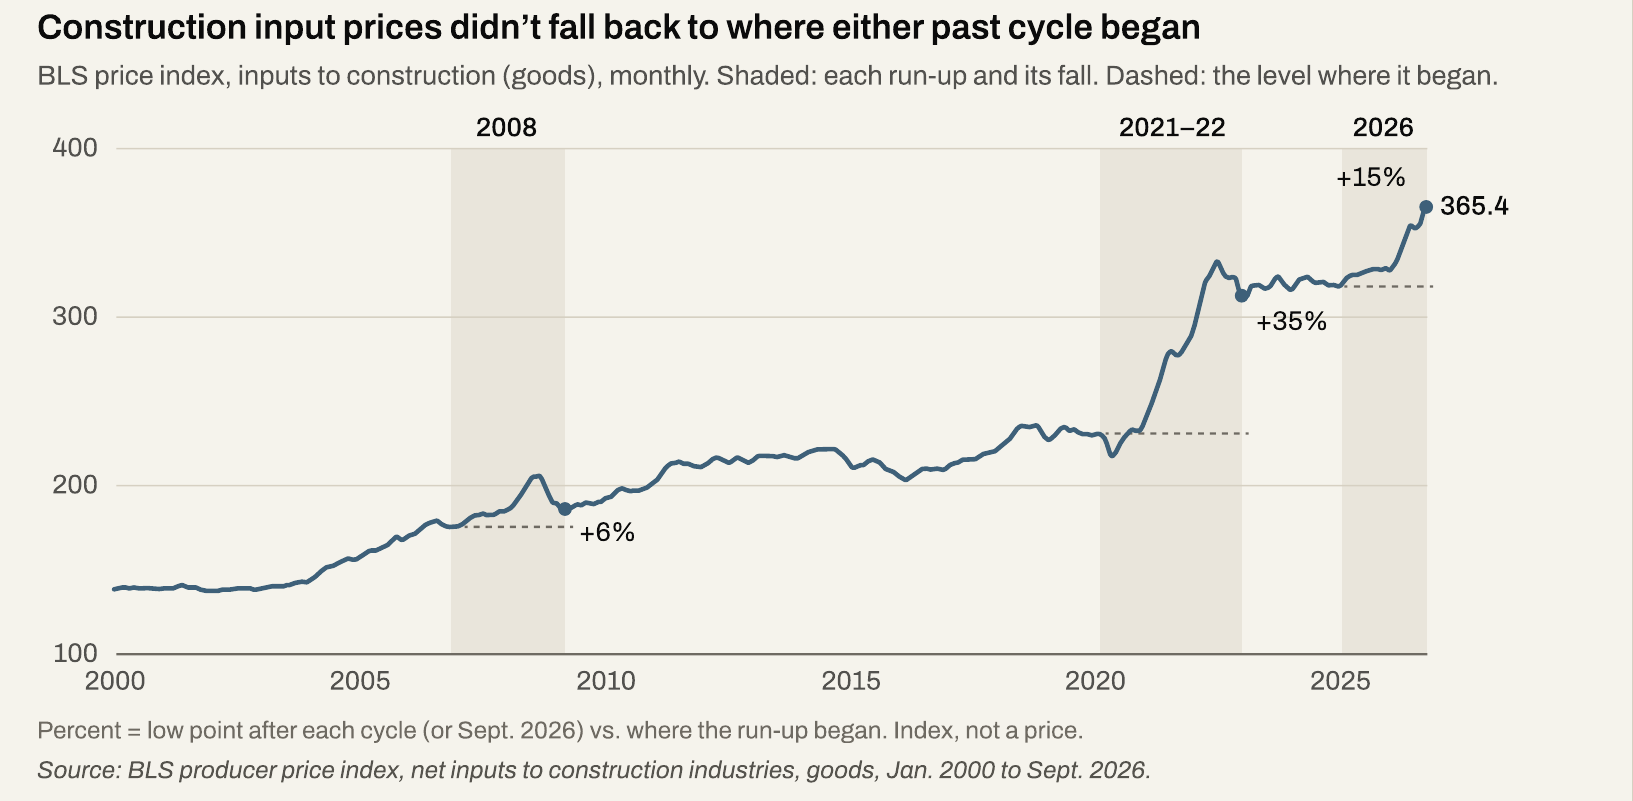
Raw materials came down less after 2021–22 than after 2008. In 2008, steel sheet and diesel fell below where their run-ups began; after 2021–22, steel sheet, aluminum, lumber and diesel all bottomed above it. As the head of one housing industry group put it in 2025, prices have "flatlined at a much higher level" (NMHC, via Construction Dive).
Surcharges are the part most likely to come off. GenFlex raised its roofing fuel surcharge in July 2008, when oil peaked, then cut it in steps as oil fell.
Part 3How to Tell a Price Has Stabilized
No single month tells you. In past cycles, the signs came in an order: raw-material prices turned first, lead times eased, and finished-product prices went flat months later.
A few down months aren't a turn
A short drop isn't proof of a turn. In 2021–22, three raw materials fell sharply, then bounced back within months:
| Product | Fell | Then rose |
|---|---|---|
| Steel sheet | 31% (Nov. 2021 to Mar. 2022) | 26% by May 2022 |
| Lumber | 53% (May to Sept. 2021) | 97% by March 2022 |
| Diesel | 25% (June to Aug. 2022) | 22% by October 2022 |
Source: BLS producer price indexes.
Anyone who lowered a lumber number at the September 2021 low, or held off buying steel in March 2022, paid more a few months later.
The longer a slide ran, the more likely it was to hold. Aluminum fell seven months straight after its April 2022 peak. In 2008, steel sheet fell 11 months in a row. Both marked a real top. Aluminum didn't pass its 2022 peak for more than three years, and steel sheet didn't pass its 2008 peak until 2011. The pattern holds more broadly: across five raw-material indexes since 2000 (lumber, aluminum, diesel and two for steel), a slide of six straight monthly declines held for at least a year more than three times out of four. After a two-month dip, prices got back to the old high within a year a third to half of the time (Roger's analysis of BLS data).
Finished-product prices lag, then go flat
Finished products peaked after their raw materials did, and the lag was longer in 2021–22 than in 2008. BLS has no storefront index, so the chart uses its architectural metal work index, the closest measure.
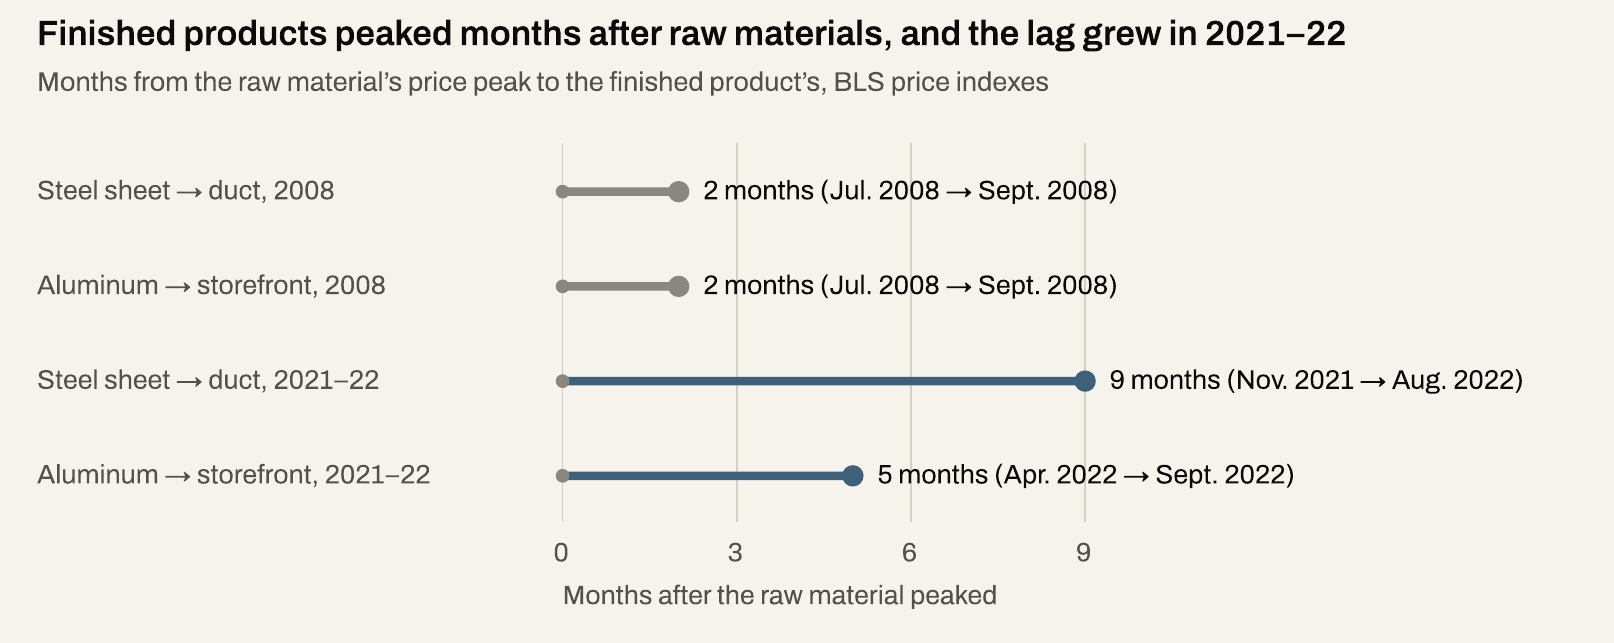
When they turned, they mostly stopped rising instead of falling. The storefront index rose more slowly through 2022, peaked that September, then dipped about 3%, then held flat. Duct and storefront prices went flat only after steel and aluminum had fallen a long way from their peaks.
The signs to watch
When past increases actually ended, these signs showed up, roughly in this order:
| Sign | What it looked like when a turn held | Where to see it |
|---|---|---|
| Raw material falls for months | Six or more straight down months, not two or three | BLS indexes; mill and supplier price letters |
| Lead times shorten | Manufacturers announce shorter lead times | Supplier quotes, steel market reports (SMU) |
| Surcharges come off | Fuel surcharges came down in steps as oil fell in 2008–09 | Supplier price letters |
| Finished-product prices go flat | A few months of near-zero change, after raw is well off its peak | Sub and supplier quotes; BLS finished-product indexes |
On equipment, the hydronic consultant said the turn shows up in manufacturers' lead-time notices, not in prices: a notice like "we were 6 to 8, now we're 3 to 4."
The headline number, the overall BLS construction input price index behind monthly reports like ABC's 11.5%, is a poor early signal. It gave almost no warning before its 2008 and 2022 peaks, and by the time it was clearly falling, the turn had already happened. The raw materials themselves show it sooner.
Part 4Where We Are in This Cycle
This cycle hasn't turned. Steel was still rising in October 2026, and duct and storefront were at records in September, the latest month for those indexes. Lumber and diesel have dipped, but not long enough to signal a turn, and aluminum's slide paused in October.
- Still rising: steel sheet, at a high for this cycle in October 2026.
- Dipping, but not long enough to call: lumber, down three months since its July 2026 high, and diesel, whose BLS index fell in October from its September 2026 record (pump prices have eased since, to $6.13 a gallon on Nov. 9, 2026).
- Paused: aluminum fell three months after its June 2026 record, then ticked up in October.
- Creeping up: duct and storefront, both at records as of September 2026, the latest month for those indexes.
- Overall: construction input prices flat at a record in October 2026, and still 11.5% above a year earlier (BLS, via ABC).
- Lead times: still long. Swinerton's fall 2026 report puts typical wide-flange steel at 40 to 50 weeks, more than double the quarter before. The hydronic consultant says his lead times are about double what they were 18 months ago, and he doesn't expect them to come down for at least 12 to 18 months. Electrical gear is the longest wait: Swinerton lists generators at 30 to 110 weeks and medium-voltage liquid-filled transformers at 30 to 120. Our first Field Briefing, on the data center buildout, covers why.
- Surcharges: not coming off cleanly. When Atlas Roofing dropped its tariff surcharge on synthetic underlayment in April 2026, it moved the product to new price levels the same day.
Source: BLS producer price indexes, through October 2026 (duct and storefront through September 2026), not seasonally adjusted. BLS revises the last four months.
Duct and storefront prices have further to climb. In 2021–22, they kept rising for five to nine months after their metals peaked (in 2008, two). If aluminum's June 2026 high turns out to be its peak, the 2021–22 pattern would have storefront leveling off between late 2026 and early 2027. Steel hasn't peaked yet, so duct would have longer to run.
Lumber is the one to watch for a real turn. It's a traded commodity, it has fallen three months in a row, August through October 2026, and in October 2026 Commerce finalized a cut in duties on most Canadian lumber, though a separate lumber tariff still applies. If it keeps falling through the winter of 2026–27, it would look like the turns that held.
Thanks, your download is starting.
If the download doesn't start, get the PDF here.